Geneviève K. Smith
Scientist, team builder, startup advisor Former VP Product at Insight Data Science She / her, how to pronounce my name
bio | projects
linkedin | twitter | github | medium

Cryptic Species Coexistence | Damselfly Wing Morphometrics
Dating Shakespeare | Flu Visualization | Forest Resilience
Forest Resilience to Large-Scale Clearing.
Existing public databases from long-term ecological research stations provide great opportunities for asking biological questions at large spatial and temporal scales, such as: How do whole ecosystems respond to disturbance events? Do different aspects of community structure and ecosystem function respond in different ways? Or at different scales?
Our first step was to assemble a data set from the Hubbard Brook Ecosystem Study, which required combining data collected over many decades, under different sampling regimes, at multiple sites, using publicly-available raw files.
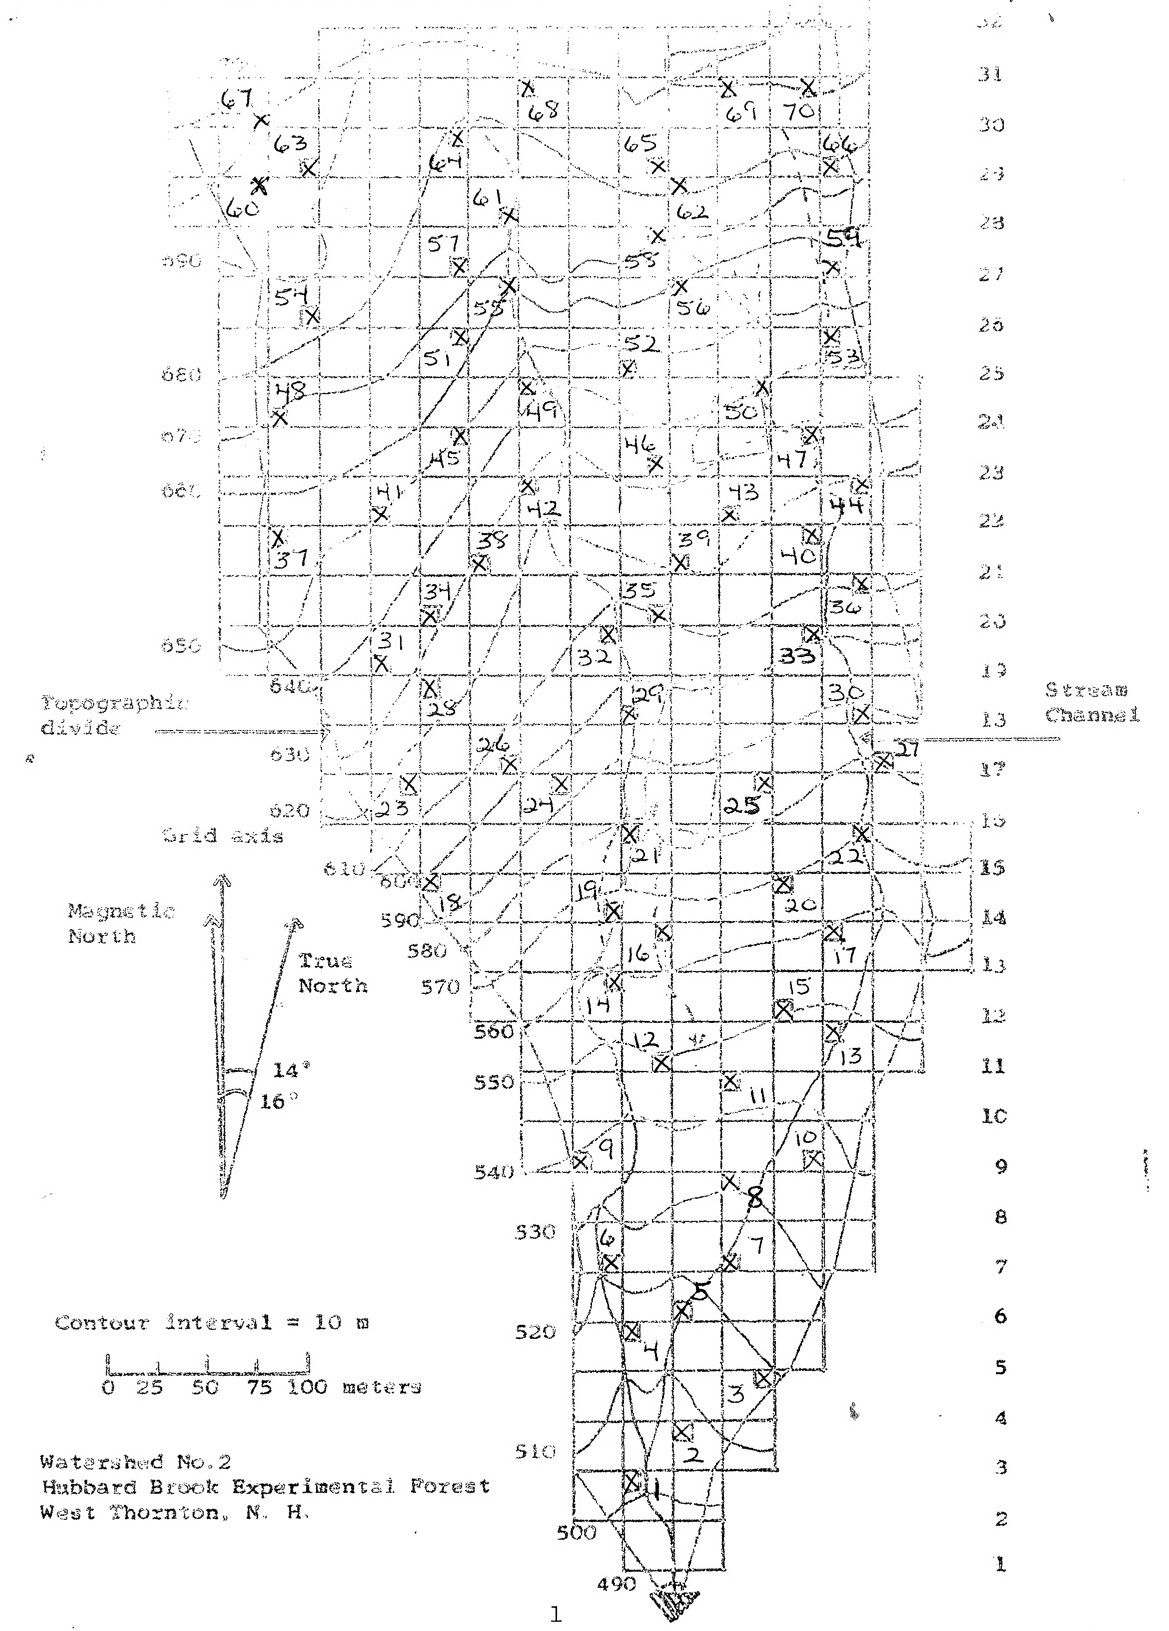
Map of an experimental watershed at the Hubbard Brook Research Forest, New Hampshire, USA. Gridlines indicate the boundaries of the sampling plots and the contour lines indicate elevation.
We re-analyzed data from a deforestation experiment at the Hubbard Brook Research Forest and included new addition to standard measures of diversity and structure, we incorporated phylogenetic information and species trait data into our analysis. Our goal was to determine whether the resilience of individual ecosystem properties (i.e. the restoration of species diversity to pre-disturbance levels) is similar or whether aspects of the system return at different rates, have differing levels of initial displacement, or find their way back to different equilibria.

Species were distributed across the watershed in unique patterns. Some, like Sugar Maple (Acer saccharum), have high biomass in some locations but are less abundant in others. Others are absent from some areas altogether, for example Balsam Fir (Abies balsamea) which is restricted to only a handful of plots. And other species have generally very uniform distributions across the watershed. For example, Yellow Birch (Betula alleghaniensis) is consistently found in high abundance, while Jack-in-the-pulpit (Arisaema triphyllum, an herbaceous species) represents a much lower amount of biomass. These data were collected in 1979, ten years after the deforestation experiment in Watershed 2 was initiated.
Using a Bayesian approach to fit damped-oscillator models to the data, we found that while diversity and biomass appear to simply asymptotically approach pre-disturbance values, other metrics exhibit varied behavior, in both the amplitude and frequency of oscillations, suggesting a more nuanced view of ecosystem resilience.